 It is often difficult to pinpoint exactly why certain sectors of a sharemarket become cheap relative to others. Even harder is pinning down the catalyst that will bring the valuation pendulum back into a more sustainable position. Hardest of all though is getting the timing right – the point in the cycle when this catalyst will actually take effect.
We tend not to obsess about the catalyst or the timing. Instead, we look for the pendulums that are at or near an extreme; those companies or sectors which we think are likely to reward investors handsomely when the pendulum rights itself.
Relative to large companies, Australia’s small capitalisation shares are nearing extreme valuations. The graph illustrates this and plots the performance of the S&P/ASX Small Ordinaries Accumulation Index relative to the S&P/ASX 100 Accumulation Index (the largest 100 companies).
Performance of small companies relative to large companies in Australia
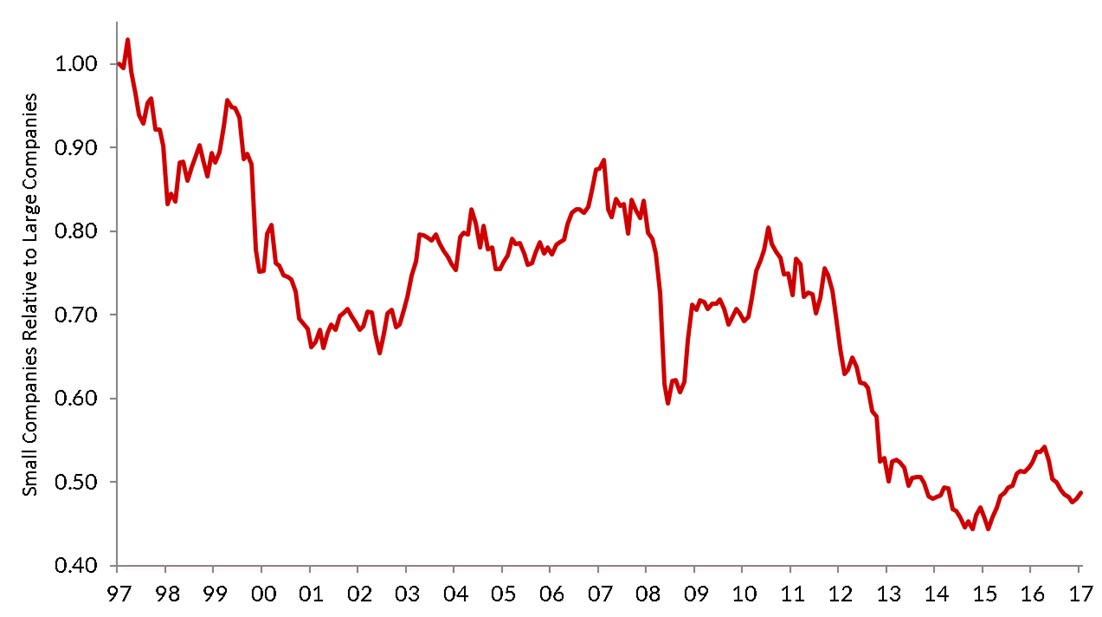
Source: Iress, S&P/ASX Small Ordinaries Accumulation Index relative to the S&P/ASX 100 Accumulation Index
Despite the small end of town having rebounded a little from its early-2015 lows, it has significantly underperformed over the past 20 years and has underperformed the top 100 by 7% in the 2017 financial year alone. It has been argued that this is the result of a shift to passive and ETF investing, where it is possible to replicate 87% of a market’s exposure with the top 100 share positions. It’s not clear – this shift to passive investing is a global phenomenon but it hasn’t resulted in similar underperformance of small capitalisation stocks in other large developed share markets. More important than identifying the reason behind the pendulum’s shift is determining whether it is permanent or whether it will return to its swing path. We believe the significant underperformance of this sector to be temporary.
The table shows that, relative to its benchmark, the Australian Equity portfolio has over three times more (by portfolio weight) exposure to companies outside of the largest 100 shares in the S&P/ASX 300 Accumulation Index. It is in this segment of the sharemarket that we see some of the most attractive investment opportunities and you can read more in our latest Quarterly Commentary.
Weighting of large and small companies in the benchmark and portfolio
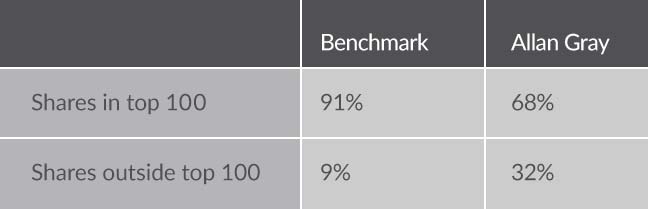
Source: Iress, weights in the S&P/ASX 300 Accumulation Index and the Allan Gray Australia Equity Strategy
Simon Mawhinney holds a Bachelor of Business Science (First Class Honours) with majors in Finance and Business Strategy and a Postgraduate Diploma in Accounting (University of Cape Town). Simon qualified as a Chartered Accountant in 1998 and is a CFA Charterholder.
Figures are at 30 June 2017 unless otherwise stated.
Share
Equity Trustees Limited ABN 46 004 031 298, AFSL No. 240975 is the issuer of units in the Allan Gray Australia Balanced Fund ARSN 615 145 974, Allan Gray Australia Equity Fund ARSN 117 746 666 and Allan Gray Australia Stable Fund, ARSN 149 681 774 (Allan Gray Funds) and units in the Orbis Global Equity Fund (Australia registered) ARSN 147 222 535, Orbis Global Equity LE Fund (Australia registered) ARSN 613 753 030 and Orbis Global Balanced Fund (Australia registered) ARSN 615 545 170 (Orbis Funds). Allan Gray Australia Pty Limited ABN 48 112 316 168, AFSL No. 298487 is the investment manager of the Allan Gray Funds.
Past performance is not a reliable indicator of future performance. There are risks involved with investing and the value of your investments may fall as well as rise. This represents Allan Gray Australia Pty Limited and Orbis Investment Advisory Pty Limited’s view at a point in time and may provide reasoning or rationale on why we bought or sold a particular security for the Allan Gray or Orbis Funds or our clients. We may take the opposite view/position from that stated, as our view may change. If this article is authored by Orbis, it does not prohibit the Orbis Funds from dealing in the securities before or after this article is published. This article constitutes general advice or information only and not personal financial product, tax, legal, or investment advice. It does not take into account the specific investment objectives, financial situation or individual needs of any particular person and may not be appropriate for you. We have tried to ensure that the information here is accurate in all material respects, but cannot guarantee that it is.
You should consider the relevant funds’ Product Disclosure Statement (PDS) or Information Memorandum (IM), as applicable, before acquiring, holding or disposing units in the Allan Gray or Orbis Funds. The PDS or IM can be obtained from
www.orbis.com.au and www.allangray.com.au.
Target Market Determinations (TMDs) for the Allan Gray products can be found at
allangray.com.au/PDS-TMD-documents,
while TMDs for the Orbis Funds can be found at www.orbis.com.au on the 'Forms' page under 'How to Invest'. Each TMD sets out who an investment in the relevant Allan Gray or Orbis Funds might be appropriate for and the circumstances that trigger a review of the TMD.
Managed investment schemes are generally medium to long-term investments. They are traded at prevailing prices and the value of units may go down as well as up. There are risks with investing the Fund and there is no guarantee of repayment of capital or return on your investment. Subject to relevant disclosure documents, managed investments can engage in borrowing and securities lending. A schedule of fees and charges is available in the PDS.


Still has an output even underpressure of shrinking economic state
I am a shareholder in the troubled Acrux Pty Ltd who had current assets of $39.6m at its latest annual report.
I note that your firm is a substantial shareholder at around 15% and was wondering if your firm has ever considered buying a majority in the company?
Regards
Wayne Saxvik
Hi Wayne, thanks for getting in touch. We no longer hold Acrux, we sold out a few months ago. We don’t typically own more than 20% of a company across all of our portfolios, as we are always aware of takeover regulations.